Analyze key retail and supply chain performance indicators for a fictional enterprise.
- Counter – Overall Customer Count
- Counter – TPCH – Number Suppliers
- Map – National Revenue Map
- Bar- National Revenue Trends
- Table – Customer Value
- Line – Order Revenue
1. Counter – Overall Customer Count
SELECT
  COUNT(distinct(c_custkey))
FROM
  `samples`.`tpch`.`customer`

2. Counter – TPCH – Number Suppliers
SELECT
  COUNT(distinct(s_suppkey)) AS num_suppliers
FROM
  `samples`.`tpch`.`supplier`

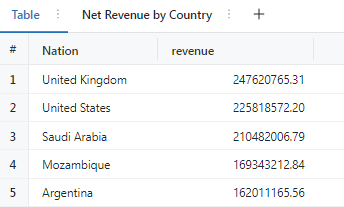
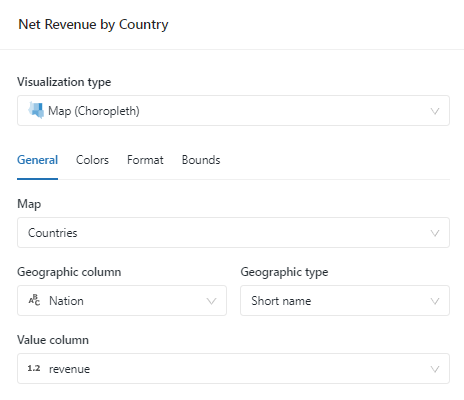
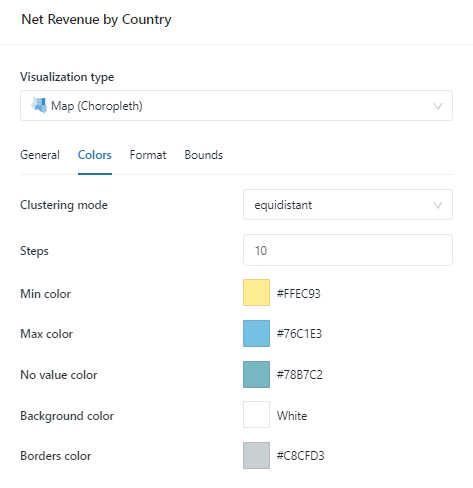
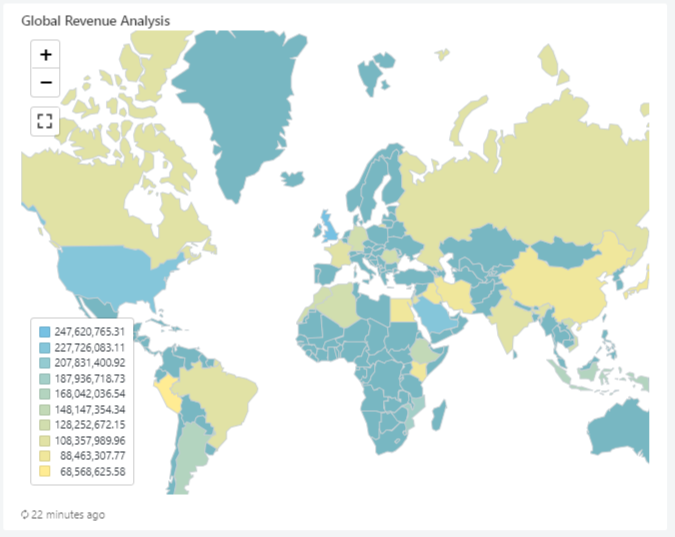
3. Map – National Revenue Map
SELECT
    initcap(n_name) AS `Nation`,
    SUM(l_extendedprice * (1 - l_discount) * (length(n_name)/100)) AS revenue
FROM
    `samples`.`tpch`.`customer`,
    `samples`.`tpch`.`orders`,
    `samples`.`tpch`.`lineitem`,
    `samples`.`tpch`.`supplier`,
    `samples`.`tpch`.`nation`,
    `samples`.`tpch`.`region`
WHERE
    c_custkey = o_custkey
    AND l_orderkey = o_orderkey
    AND l_suppkey = s_suppkey
    AND c_nationkey = s_nationkey
    AND s_nationkey = n_nationkey
    AND n_regionkey = r_regionkey
GROUP BY
    INITCAP(n_name)
ORDER BY
    revenue DESC;
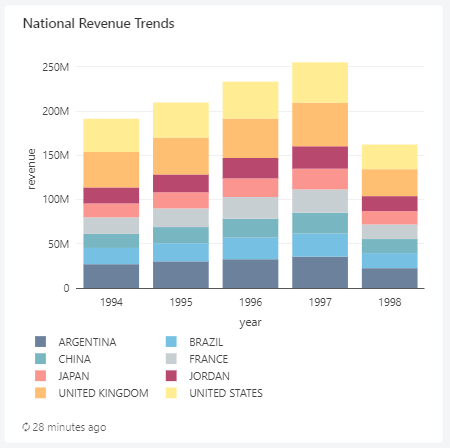
4. Bar- National Revenue Trends
SELECT
    year(o_orderdate) AS year,
    n_name AS nation,
    sum(l_extendedprice * (1 - l_discount) * (((length(n_name))/100) + (year(o_orderdate)-1993)/100)) AS revenue
FROM
    `samples`.`tpch`.`customer`,
    `samples`.`tpch`.`orders`,
    `samples`.`tpch`.`lineitem`,
    `samples`.`tpch`.`supplier`,
    `samples`.`tpch`.`nation`,
    `samples`.`tpch`.`region`
WHERE
    c_custkey = o_custkey
    AND l_orderkey = o_orderkey
    AND l_suppkey = s_suppkey
    AND c_nationkey = s_nationkey
    AND s_nationkey = n_nationkey
    AND n_regionkey = r_regionkey
    AND n_name in ('ARGENTINA', 'UNITED KINGDOM', 'FRANCE','BRAZIL', 'CHINA', 'UNITED STATES', 'JAPAN', 'JORDAN')
    AND o_orderdate >= DATE '1994-01-01'
GROUP BY
    1,2
ORDER BY
    nation ASC LIMIT 1000;
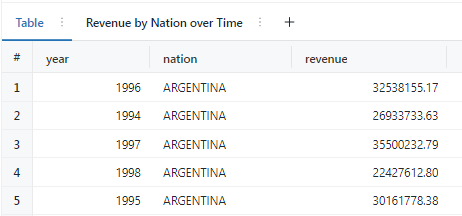
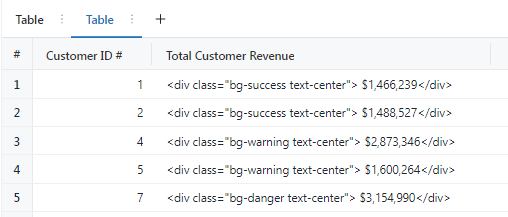
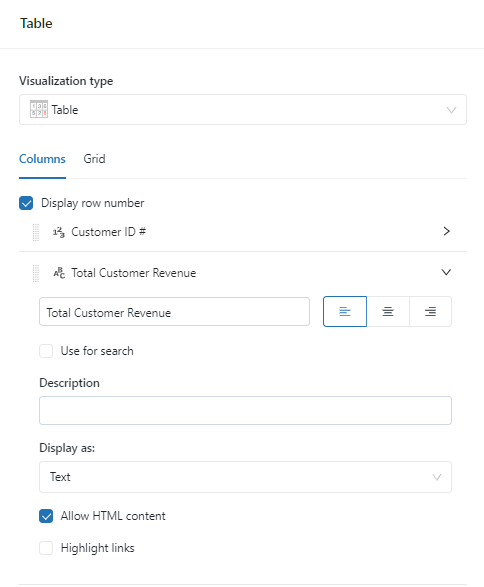
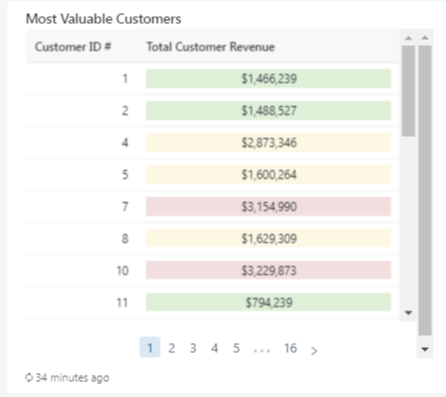
5. Table – Customer Value
SELECT
  customer_id AS `Customer ID #`,
  concat(
    '<div class="bg-',
    CASE
      WHEN total_revenue BETWEEN 0
      AND 1500000 THEN 'success'
      WHEN total_revenue BETWEEN 1500001
      AND 3000000 THEN 'warning'
      WHEN total_revenue BETWEEN 3000001
      AND 5000000 THEN 'danger'
      ELSE 'danger'
    END,
    '  text-center"> $',
    format_number(total_revenue, 0),
    '</div>'
  ) AS `Total Customer Revenue`
FROM
  (
    SELECT
      o_custkey AS customer_id,
      sum(o_totalprice) as total_revenue
    FROM
      `samples`.`tpch`.`orders`
    GROUP BY
      1
    HAVING
      total_revenue > 0
  )
ORDER BY
  1
LIMIT
  400
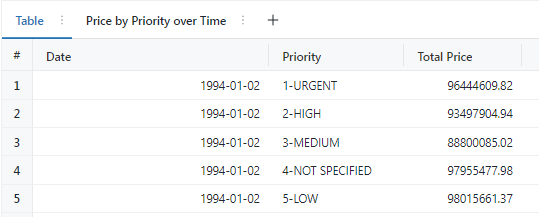
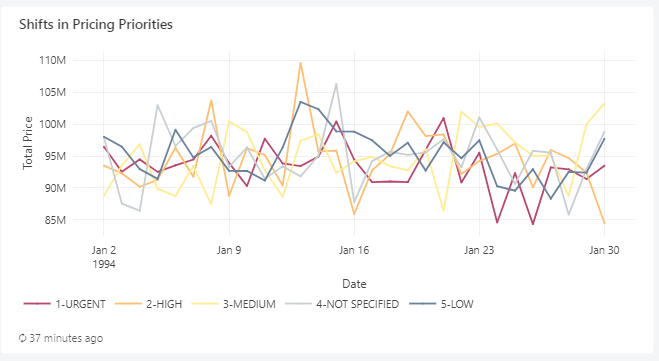
6. Line – Order Revenue
SELECT
  o_orderdate AS Date,
  o_orderpriority AS Priority,
  sum(o_totalprice) AS `Total Price`
FROM
  `samples`.`tpch`.`orders`
WHERE
  o_orderdate > '1994-01-01'
  AND o_orderdate < '1994-01-31'
GROUP BY
  1,
  2
ORDER BY
  1,
  2