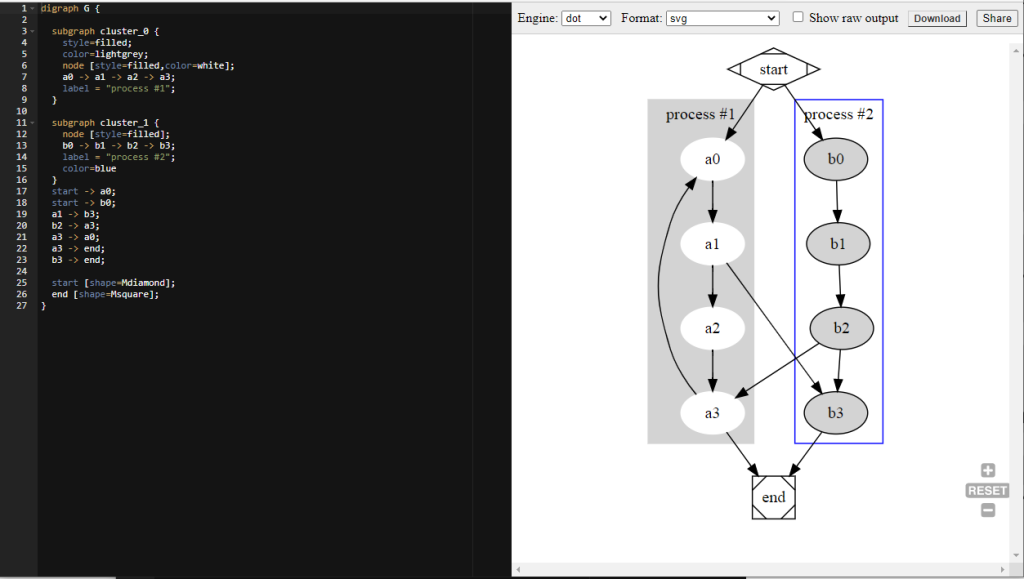
Graphviz online
- GitHub – dreampuf/GraphvizOnline: Let’s Graphviz it online
- https://dreampuf.github.io/GraphvizOnline/
GraphvizOnline lets you edit and view GraphViz diagrams online. You can use GraphvizOnline online here.
Resources
- graphviz.org
- DOT Language | Graphviz
- dotguide.pdf (graphviz.org)
- Graphviz (dot) examples (renenyffenegger.ch)
DOT Language – digraph examples
Node
digraph DG {
  A
}

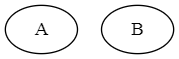
digraph DG {
  A
  B
}
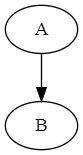
Edge
digraph DG {
  A -> B
}
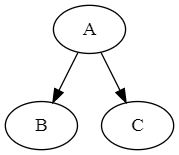
digraph DG {
  A -> B
  A -> C
}
or
digraph DG {
  A -> {B, C}
}
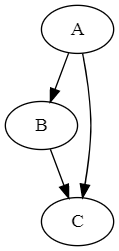
digraph DG {
  A -> B
  A -> C
  B -> C
}
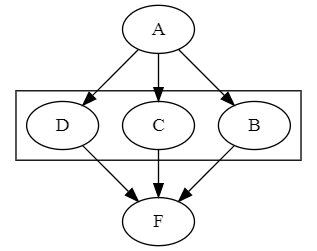
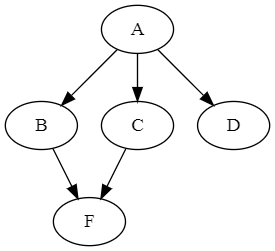
digraph DG {
  A -> {B, C, D}
  {B, C} -> {F}
}
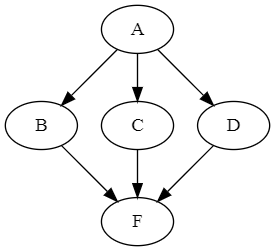
digraph DG {
  A -> {B, C, D}
  {B, C, D} -> {F}
}
or
digraph DG {
  A -> {B, C, D} -> {F}
}
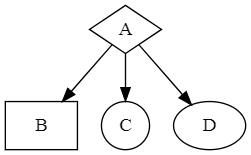
Shape
digraph DG {

  A [shape=diamond]
  B [shape=box]
  C [shape=circle]

  A -> B
  A -> C
  A -> D

}
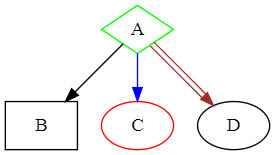
Color
digraph DG {

  A [shape=diamond, color=green]
  B [shape=box]
  C [color=red]

  A -> B
  A -> C [color=blue]
  A -> D [color="brown:invis:brown"]

}
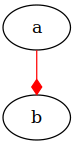
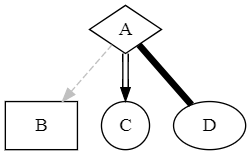
style, penwidth, arrowhead
digraph D {

  A [shape=diamond]
  B [shape=box]
  C [shape=circle]

  A -> B [style=dashed, color=grey]
  A -> C [color="black:invis:black"]
  A -> D [penwidth=5, arrowhead=none]

}
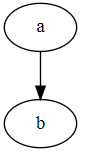
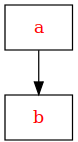
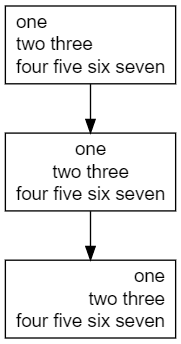
Aligned text
digraph DG {

  node [shape=record fontname=Arial];

  a  [label="one\ltwo three\lfour five six seven\l"]
  b  [label="one\ntwo three\nfour five six seven"]
  c  [label="one\rtwo three\rfour five six seven\r"]

  a -> b -> c

}
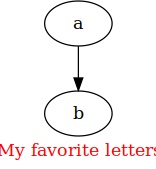
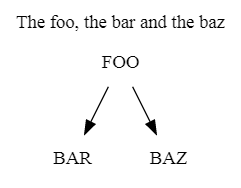
Graph title (label)
digraph DG {

  label = "The foo, the bar and the baz";
  labelloc = "t"; // place the label at the top (b seems to be default)

  node [shape=plaintext]

  FOO -> {BAR, BAZ};

}
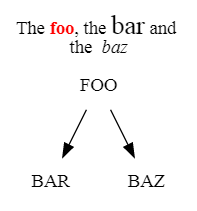
HTML label
digraph DG {
  label = <The <font color='red'><b>foo</b></font>, the <font point-size='20'>bar</font>  and<br/> the <i>baz</i>>;
  labelloc = "t"; // place the label at the top (b seems to be default)

  node [shape=plaintext]

  FOO -> {BAR, BAZ};
}
Subgraph
digraph DG {
  A -> {B, C, D} -> {F}

  subgraph cluster_R {
    rank=same B C D
  }
}